The Best Trading Indicators for Binary Options

The Best Trading Indicators for Binary Options
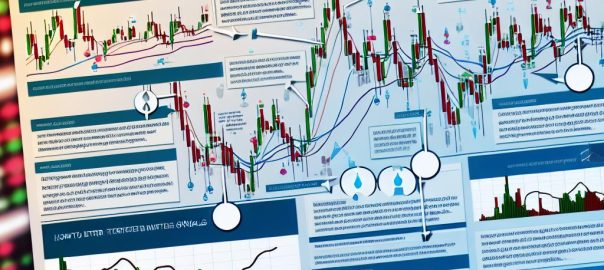
Binary options trading has gained popularity as a form of financial market participation, offering traders the opportunity to speculate on the price direction of various assets, such as stocks, commodities, and currencies. A critical component of successful trading involves the use of technical indicators, which serve as tools for analyzing price movements and making informed predictions. This article delves into some of the most effective trading indicators employed in binary options, providing insights into their functions and usage.
Moving Averages
Moving averages are revered among traders for their ability to smooth out price data by generating a continuously updated average price. This provides a clearer view of price trends over time, minimizing the noise created by short-term volatility.
Let’s break down the two most common types of moving averages:
Simple Moving Average (SMA): The SMA is calculated by taking the arithmetic mean of a set of prices over a specified number of periods. For instance, a 10-day SMA would sum up the closing prices of the last 10 days and divide the total by ten. This provides a straightforward measure of the average price over that period.
Exponential Moving Average (EMA): The EMA, on the other hand, gives more weight to recent price data, making it more responsive to any new information. By prioritizing the most recent prices, EMAs can provide timely signals for traders aiming to capitalize on current trends.
Using moving averages involves observing crossovers where a short-term average crosses a long-term average, signaling a potential change in trend direction. When a short-term EMA crosses above a long-term EMA, it may indicate a buying opportunity, while a crossover in the opposite direction might suggest a selling opportunity.
Relative Strength Index (RSI)
The Relative Strength Index is a momentum oscillator that quantifies the speed and magnitude of recent price changes, offering traders insights into overbought or oversold market conditions. The RSI scale ranges from 0 to 100, and it is typically used in the following manner:
– An RSI above 70 is generally interpreted as indicating that the asset is overbought, suggesting that a price correction or downward reversal may be imminent.
– Conversely, an RSI below 30 signals an oversold condition, implying that the asset could be undervalued and due for a price increase.
Traders often use RSI in conjunction with other indicators to confirm signals and avoid false readings, thereby refining their trading decisions.
Bollinger Bands
Bollinger Bands serve as dynamic volatility indicators that consist of three lines: a middle band corresponding to the SMA and two outer bands representing standard deviations away from the SMA. The distance between these outer bands varies according to market volatility:
– During periods of high volatility, the bands widen to accommodate larger price swings.
– Conversely, during low volatility, the bands contract, providing an indication that a breakout or substantial price movement may occur.
The price’s tendency to revert to the middle of the bands makes Bollinger Bands particularly advantageous for traders seeking reversal points. When the price breaches the upper band, it may suggest an overbought market, while a move below the lower band might indicate an oversold market ready for a reversal.
Stochastic Oscillator
The Stochastic Oscillator is another momentum indicator integral to binary options trading. It measures the location of the current closing price relative to the price range over a given period. This oscillator also delivers readings from 0 to 100:
– Values above 80 often reveal an overbought market condition, signaling that a downturn or correction could be on the way.
– Conversely, values below 20 are indicative of an oversold market, suggesting potential upward movement.
By observing these extremities, traders can identify potential trend reversals. The Stochastic Oscillator is particularly useful in range-bound markets, where price tends to fluctuate within a particular set of levels.
For more in-depth understanding, it is advisable for traders to explore resources on technical analysis and practice using these indicators on a demo account to refine their strategies.
While monitoring these indicators can provide invaluable insights into market trends and possible opportunities for binary options traders, it is pertinent to note that no single indicator should be used in isolation. Trading decisions are best informed by amalgamating indicators with broader analytical approaches such as trend analysis, fundamental analysis, and market sentiment evaluation. By doing so, traders can enhance their overall trading effectiveness, minimize risks, and optimize their chance of success in the dynamic world of binary options trading.


