08 May

The Best Trading Indicators for Binary Options

The Best Trading Indicators for Binary Options

The Best Trading Indicators for Binary Options

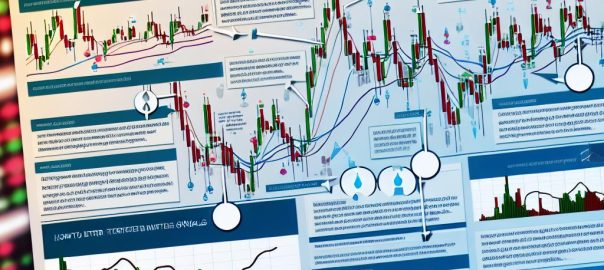
Binary options trading has gained popularity as a form of financial market participation, offering traders the opportunity to speculate on the price direction of various assets, such as stocks, commodities, and currencies. A critical component of successful trading involves the use of technical indicators, which serve as tools for analyzing price movements and making informed predictions. This article delves into some of the most effective trading indicators employed in binary options, providing insights into their functions and usage.

Moving Averages

Moving averages are revered among traders for their ability to smooth out price data by generating a continuously updated average price. This provides a clearer view of price trends over time, minimizing the noise created by short-term volatility.

Let’s break down the two most common types of moving averages:

Simple Moving Average (SMA): The SMA is calculated by taking the arithmetic mean of a set of prices over a specified number of periods. For instance, a 10-day SMA would sum up the closing prices of the last 10 days and divide the total by ten. This provides a straightforward measure of the average price over that period.

Exponential Moving Average (EMA): The EMA, on the other hand, gives more weight to recent price data, making it more responsive to any new information. By prioritizing the most recent prices, EMAs can provide timely signals for traders aiming to capitalize on current trends.

Using moving averages involves observing crossovers where a short-term average crosses a long-term average, signaling a potential change in trend direction. When a short-term EMA crosses above a long-term EMA, it may indicate a buying opportunity, while a crossover in the opposite direction might suggest a selling opportunity.

Relative Strength Index (RSI)

The Relative Strength Index is a momentum oscillator that quantifies the speed and magnitude of recent price changes, offering traders insights into overbought or oversold market conditions. The RSI scale ranges from 0 to 100, and it is typically used in the following manner:

– An RSI above 70 is generally interpreted as indicating that the asset is overbought, suggesting that a price correction or downward reversal may be imminent.
– Conversely, an RSI below 30 signals an oversold condition, implying that the asset could be undervalued and due for a price increase.

Traders often use RSI in conjunction with other indicators to confirm signals and avoid false readings, thereby refining their trading decisions.

Bollinger Bands

Bollinger Bands serve as dynamic volatility indicators that consist of three lines: a middle band corresponding to the SMA and two outer bands representing standard deviations away from the SMA. The distance between these outer bands varies according to market volatility:

– During periods of high volatility, the bands widen to accommodate larger price swings.
– Conversely, during low volatility, the bands contract, providing an indication that a breakout or substantial price movement may occur.

The price’s tendency to revert to the middle of the bands makes Bollinger Bands particularly advantageous for traders seeking reversal points. When the price breaches the upper band, it may suggest an overbought market, while a move below the lower band might indicate an oversold market ready for a reversal.

Stochastic Oscillator

The Stochastic Oscillator is another momentum indicator integral to binary options trading. It measures the location of the current closing price relative to the price range over a given period. This oscillator also delivers readings from 0 to 100:

– Values above 80 often reveal an overbought market condition, signaling that a downturn or correction could be on the way.
– Conversely, values below 20 are indicative of an oversold market, suggesting potential upward movement.

By observing these extremities, traders can identify potential trend reversals. The Stochastic Oscillator is particularly useful in range-bound markets, where price tends to fluctuate within a particular set of levels.

For more in-depth understanding, it is advisable for traders to explore resources on technical analysis and practice using these indicators on a demo account to refine their strategies.

While monitoring these indicators can provide invaluable insights into market trends and possible opportunities for binary options traders, it is pertinent to note that no single indicator should be used in isolation. Trading decisions are best informed by amalgamating indicators with broader analytical approaches such as trend analysis, fundamental analysis, and market sentiment evaluation. By doing so, traders can enhance their overall trading effectiveness, minimize risks, and optimize their chance of success in the dynamic world of binary options trading.

01 May

How to Use Candlestick Patterns in Binary Options Trading

How to Use Candlestick Patterns in Binary Options Trading

Introduction to Candlestick Patterns

Candlestick patterns serve as a fundamental tool for traders across various financial markets, including binary options trading. These patterns, which have their origins in Japan, are geared toward providing traders with visual insights into potential market dynamics. They achieve this by focusing on the opening, closing, highest, and lowest prices during a specific trading period. For traders looking to make informed decisions within the binary options market, understanding and effectively utilizing candlestick patterns can offer a profound advantage.

Understanding Candlestick Charts

Candlestick charts depict an asset’s price action in a manner that is both visually appealing and intuitive. Each individual candlestick on the chart represents four critical points of data:

  • Open: This indicates the price at which the candlestick period commenced.
  • Close: This shows the price at which the period concluded.
  • High: Denotes the highest price reached during the period in question.
  • Low: Represents the lowest price attained during that period.

The area known as the body of the candlestick, situated between the open and close prices, gives traders insight into the direction of price movement. Should the closing price exceed the opening price, the candlestick typically appears in green or white, signaling a bullish or upward trend. On the contrary, if the closing price is below the opening price, a red or black candlestick is displayed, indicating a bearish or downward trend. This visual differentiation effectively supports traders in quickly assessing market sentiment at a glance.

Types of Candlestick Patterns

There is a broad spectrum of candlestick patterns that traders utilize to gauge potential market movements. Among these, some of the more frequently cited and used patterns include:

Doji

Characterized by a very small body, a Doji reveals indecisiveness within the market. This pattern is identified when the open and close prices are significantly similar, suggesting uncertainty about the direction of future price movement. In practice, a Doji may imply an impending market reversal or trend continuation, warranting further confirmation from forthcoming candlesticks.

Hammer and Hanging Man

These two patterns, though visually similar, convey different messages. Each features a small body and a pronounced lower shadow. The Hammer appears in the context of a downtrend and indicates that a potential reversal to an upward trajectory may be on the horizon. Conversely, the Hanging Man surfaces in an uptrend, possibly signaling a move toward a downward trend. These patterns can provide clues about shifting momentum.

Engulfing

The Engulfing pattern comprises two distinct candles where the body of the second entirely envelops the preceding one. A bullish engulfing pattern, arising at the close of a downtrend, suggests a likely upward reversal. Conversely, a bearish engulfing pattern at the termination of an uptrend hints at a potential downward shift. Such patterns are indicative of evolving market sentiment.

Using Candlestick Patterns in Binary Options Trading

Within the realm of binary options trading, the ability to accurately forecast price movements is pivotal. Though candlestick patterns can offer valuable insights, they are most effective when used in concert with additional analytical techniques. Several strategic approaches are advised to maximize the efficacy of candlestick analysis:

Combine with Technical Indicators

Integrating candlestick patterns with technical indicators such as the Relative Strength Index (RSI), Moving Average Convergence Divergence (MACD), or Bollinger Bands can enhance predictive accuracy. These indicators offer additional layers of confirmation regarding the trends indicated by a specific candlestick pattern.

Examples of Technical Indicator Synergy

When using RSI alongside a candlestick pattern, traders can ascertain whether an asset is overbought or oversold, providing context to the pattern. For instance, a bullish engulfing pattern combined with an RSI reading below 30 might affirm a strong buy signal. Similarly, employing MACD can help in identifying shifts in market momentum, supporting candlestick pattern analysis.

Look for Strong Patterns with Confirmation

When a distinctive candlestick pattern emerges, it is prudent to await confirmation before taking action. This can be achieved via subsequent price movements or an additional technical indicator. For example, spotting a bullish engulfing pattern should prompt a watch for the next candlestick to perpetuate the upward trend before deciding on a call option.

Understanding Confirmation Signals

Confirmation signals can take various forms, such as a continuation in volume or a corroborating signal from another indicator. The appearance of a subsequent candlestick closing above the high of the engulfing pattern, for example, would solidify the likelihood of the upward trend continuation, giving traders more confidence in executing trades.

Risk Management

Irrespective of how compelling a particular candlestick pattern might be, unforeseeable market events can induce unexpected price fluctuations. Implementing solid risk management practices is crucial in alleviating potential financial losses. Techniques such as establishing stop-losses or managing position sizes are vital in providing a safety net for investments, thereby aiding in the longevity and success of a trading strategy.

The Role of Stop-Loss Strategies

Stop-loss orders serve as preemptive measures to limit potential losses by automatically triggering the sale of an asset when it reaches a specific price threshold. By strategically placing stop-losses based on technical analysis and trend evaluation, traders can reduce emotional trading and adhere to a more disciplined approach.

Conclusion

Candlestick patterns represent a robust instrument for anticipating market behavior, rendering them indispensable in binary options trading. Through the comprehension and application of these patterns, particularly when combined with other tools of technical analysis, traders are better equipped to make informed trading decisions. Continuous skill enhancement and strategy refinement are imperative to adapting to the fluid dynamics of financial markets. By doing so, traders can optimize their outcomes and navigate the complexities of trading with increased proficiency.